Debugging is of great importance! Mastering debugging in the coding process will significantly enhance your coding speed and time you will cost when your codes get an error.
“The most effective debugging tool is still careful thought, coupled with judiciously placed print statements” — Brian Kernighan, Unix for Beginners.
This is the simplest way, somehow, an “effective” way to find your bugs in your code by using print functions to print all the significant variables and statements where you encountered your bug.
It is simple, but sometimes naive. We need to learn some advance techniques for better performance and efficiency. So that is why we need to learn debugging!
""" Author: Xiyuan Yang xiyuan_yang@outlook.com Date: 2025-02-23 20:59:54 LastEditors: Xiyuan Yang xiyuan_yang@outlook.com LastEditTime: 2025-04-26 10:20:22 FilePath: /Lec6_Debugging/log_test.py Description: The test for the logging in python Do you code and make progress today? Copyright (c) 2025 by Xiyuan Yang, All Rights Reserved. """
# import logging package for python: import logging import random import time from datetime import datetime
# Getting time stamp timestamp = datetime.now().strftime("%Y%m%d_%H-%M-%S")
# Create a StreamHandler for console output console_handler = logging.StreamHandler() console_handler.setLevel(logging.ERROR) formatter = logging.Formatter("%(asctime)s - %(levelname)s - %(message)s") console_handler.setFormatter(formatter)
# Add the console handler to the root logger logging.getLogger().addHandler(console_handler) logger = logging.getLogger(__name__)
defsimulation(epoch=100, maxsize=1000000): """generate a random integer k from 1 to 10000, for every time: if k % 500 == 0, the log level is "ERROR" if k % 100 == 0, the log level is "WARNING" for any other stuf, the log level is "DEBUG" and print the value of k for several certain epochs, we will print log.INFO """ random.seed(2025)
# for info messages for i inrange(epoch): time.sleep(0.01) if i == 0: logger.info("The simulation begins") elif i % 100 == 0: logger.info(f"Now is the {i} rounds of simulation")
# generate random number num = random.randint(1, maxsize)
# logging if num % 500 == 0: logger.error( f"Error!, the {i}th simulation's value is {num}, is a multiple of 500" ) elif num % 100 == 0: logger.warning( f"Warning!, the {i}th simulation's value is {num}, is a multiple of 100" ) else: logger.debug(f"The {i}th simulation's value is {num}")
if i == epoch - 1: logger.info("The simulation ends")
Just simply output several logging messages isn’t enough! For example, you can not detect memory leak with printing all variables and messages. Thus, we need more specific tools to debugging!
例如当你不断的遇到segmentation fault的时候。😅
不过我们这里将会主要聚焦于Python的Debugging和Profiling~
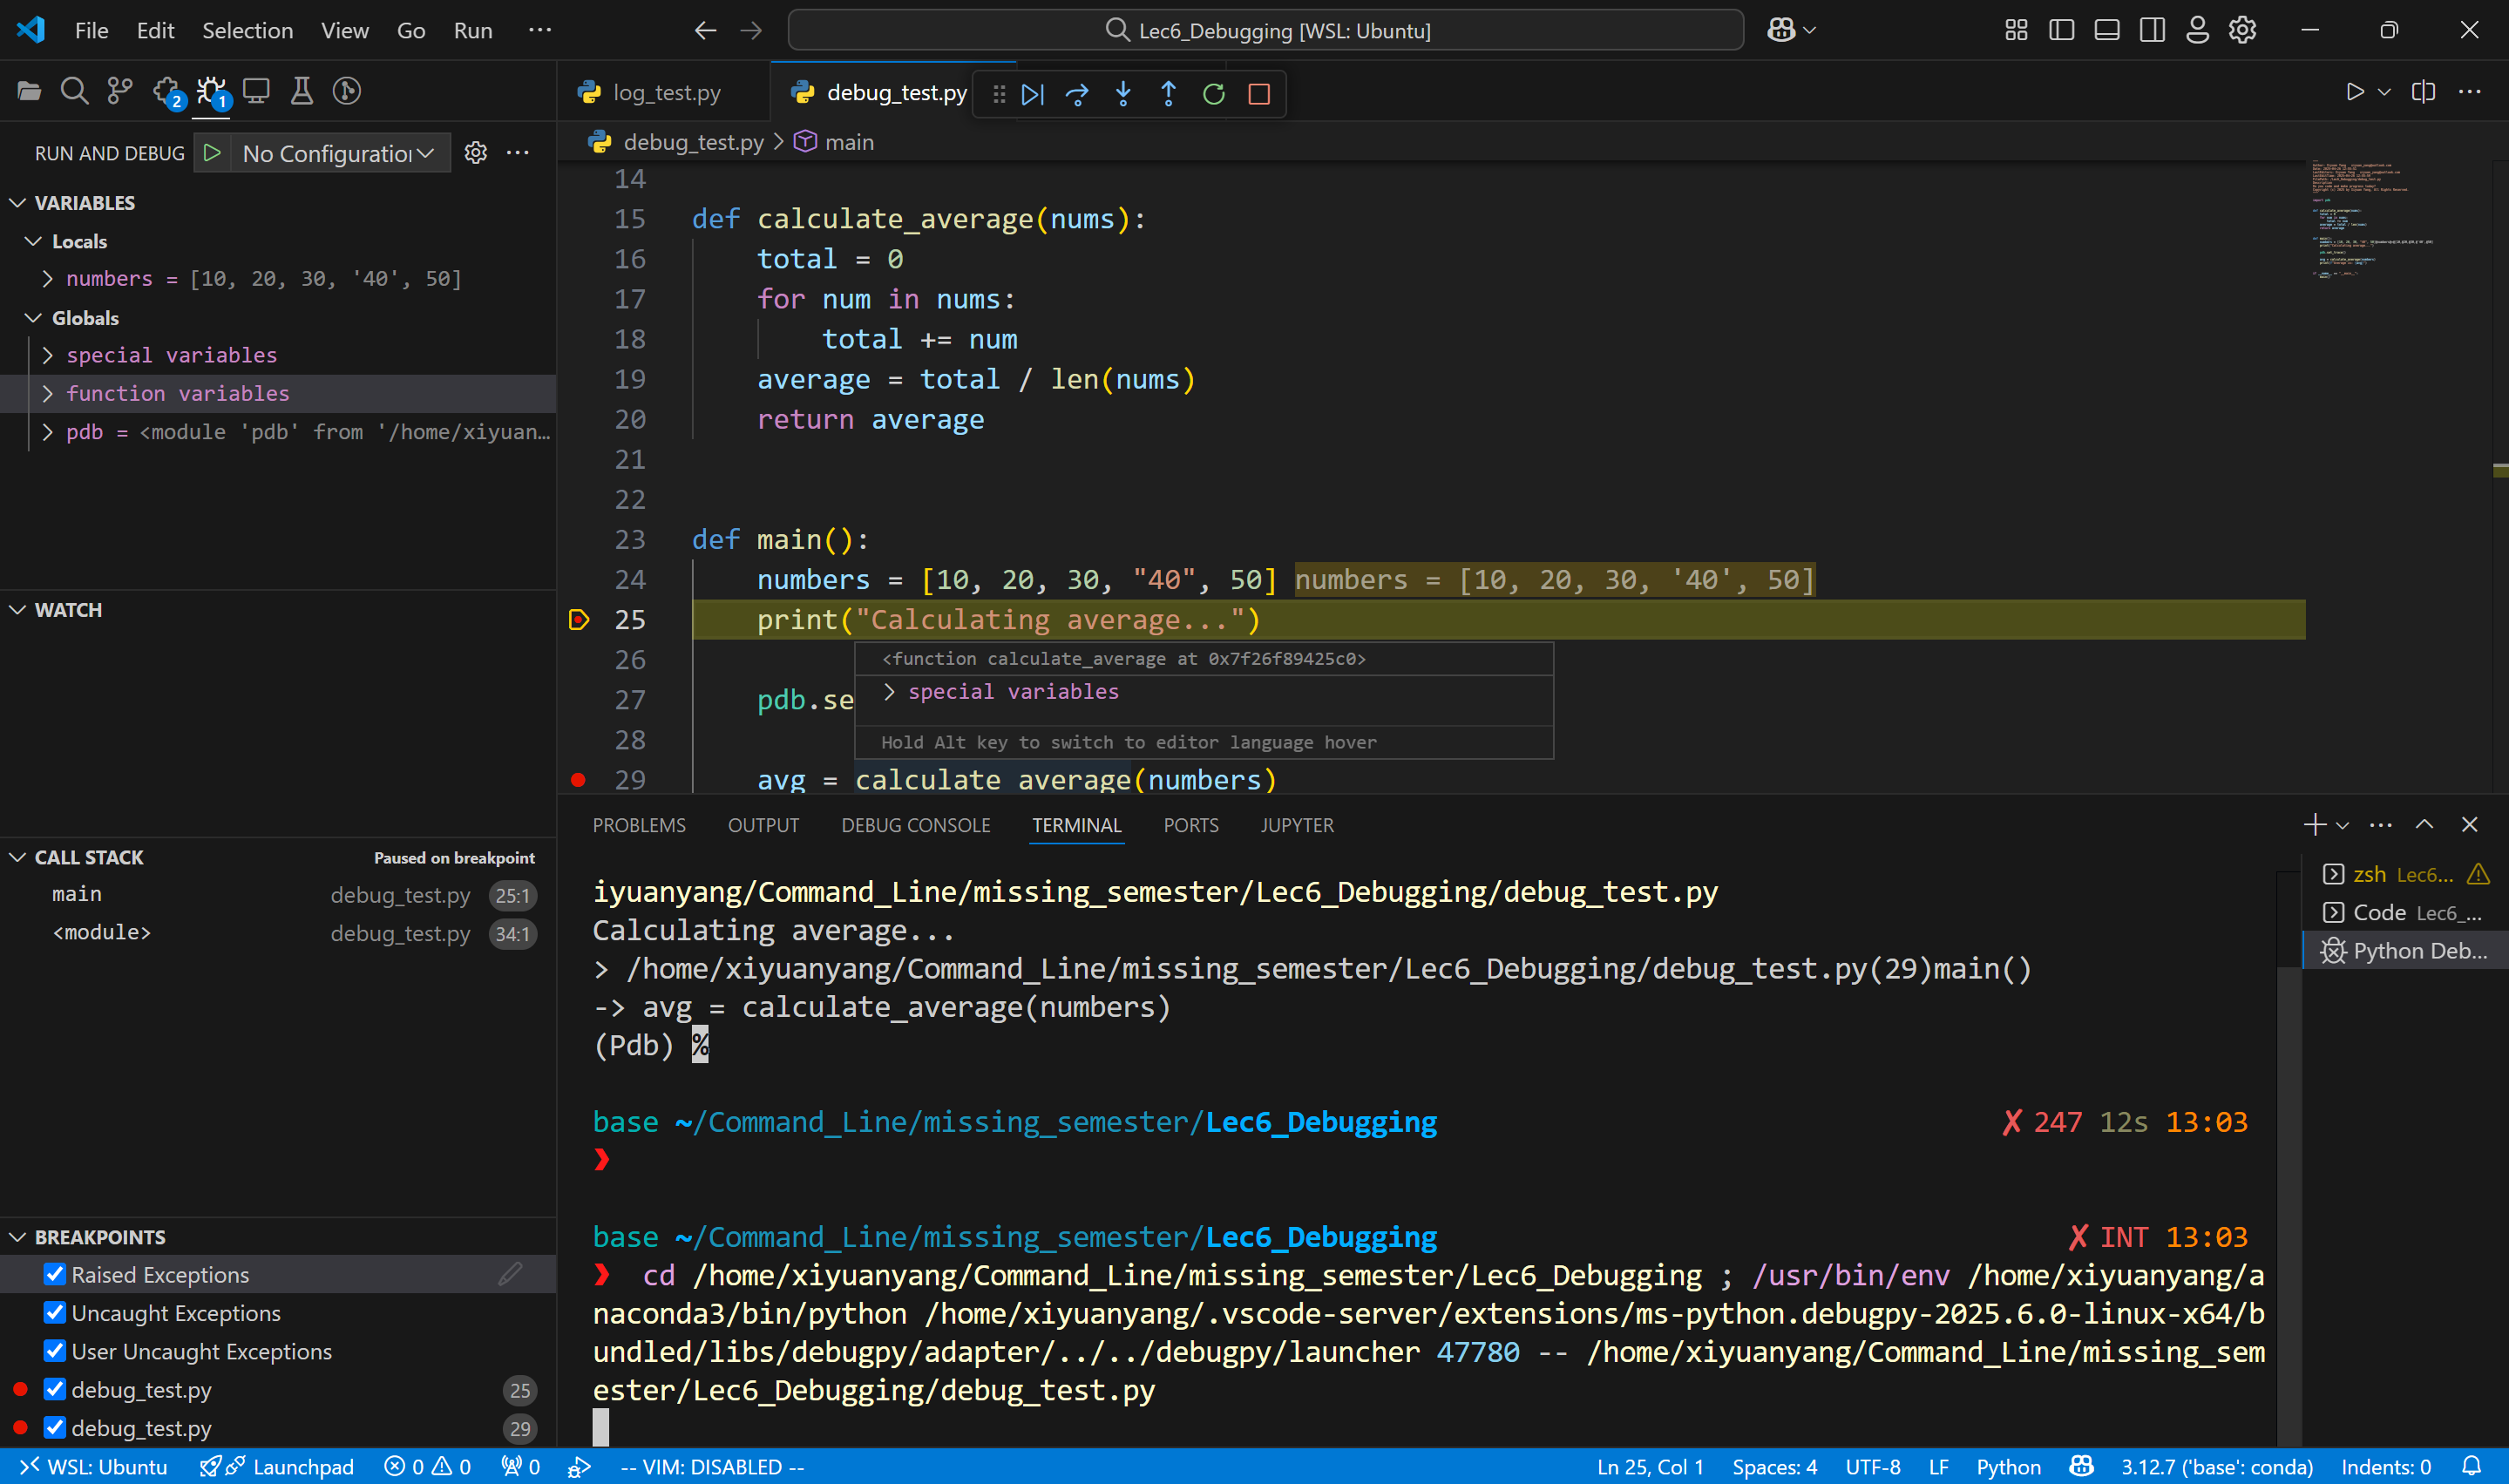
Many programming languages come with some form of debugger. In Python this is the Python Debugger pdb.
Here is a brief description of some of the commands pdb supports:
l(ist) - Displays 11 lines around the current line or continue the previous listing.
s(tep) - Execute the current line, stop at the first possible occasion.
n(ext) - Continue execution until the next line in the current function is reached or it returns.
b(reak) - Set a breakpoint (depending on the argument provided).
p(rint) - Evaluate the expression in the current context and print its value. There’s also pp to display using pprint instead.
r(eturn) - Continue execution until the current function returns.
""" Author: Xiyuan Yang xiyuan_yang@outlook.com Date: 2025-04-26 12:55:51 LastEditors: Xiyuan Yang xiyuan_yang@outlook.com LastEditTime: 2025-04-26 12:55:59 FilePath: /Lec6_Debugging/debug_test.py Description Do you code and make progress today? Copyright (c) 2025 by Xiyuan Yang, All Rights Reserved. """
import pdb
defcalculate_average(nums): total = 0 for num in nums: total += num average = total / len(nums) return average
defgenerate_matrix(n): """Generate an n x n random matrix with values between 0 and 1.""" return [[random.random() for _ inrange(n)] for _ inrange(n)]
defmatrix_multiply(a, b): """Matrix multiplication (pure Python, intentionally unoptimized).""" n = len(a) result = [[0.0for _ inrange(n)] for _ inrange(n)] for i inrange(n): for j inrange(n): for k inrange(n): result[i][j] += a[i][k] * b[k][j] return result
defmatrix_multiply_np(a, b): """Matrix multiplication (optimized with NumPy).""" return np.dot(a, b)
deftest_performance(n=100): """Test performance of matrix multiplication.""" # Generate two n x n matrices a = generate_matrix(n) b = generate_matrix(n)
# Pure Python implementation print(f"Testing Native Python (n={n})...") result_py = matrix_multiply(a, b)
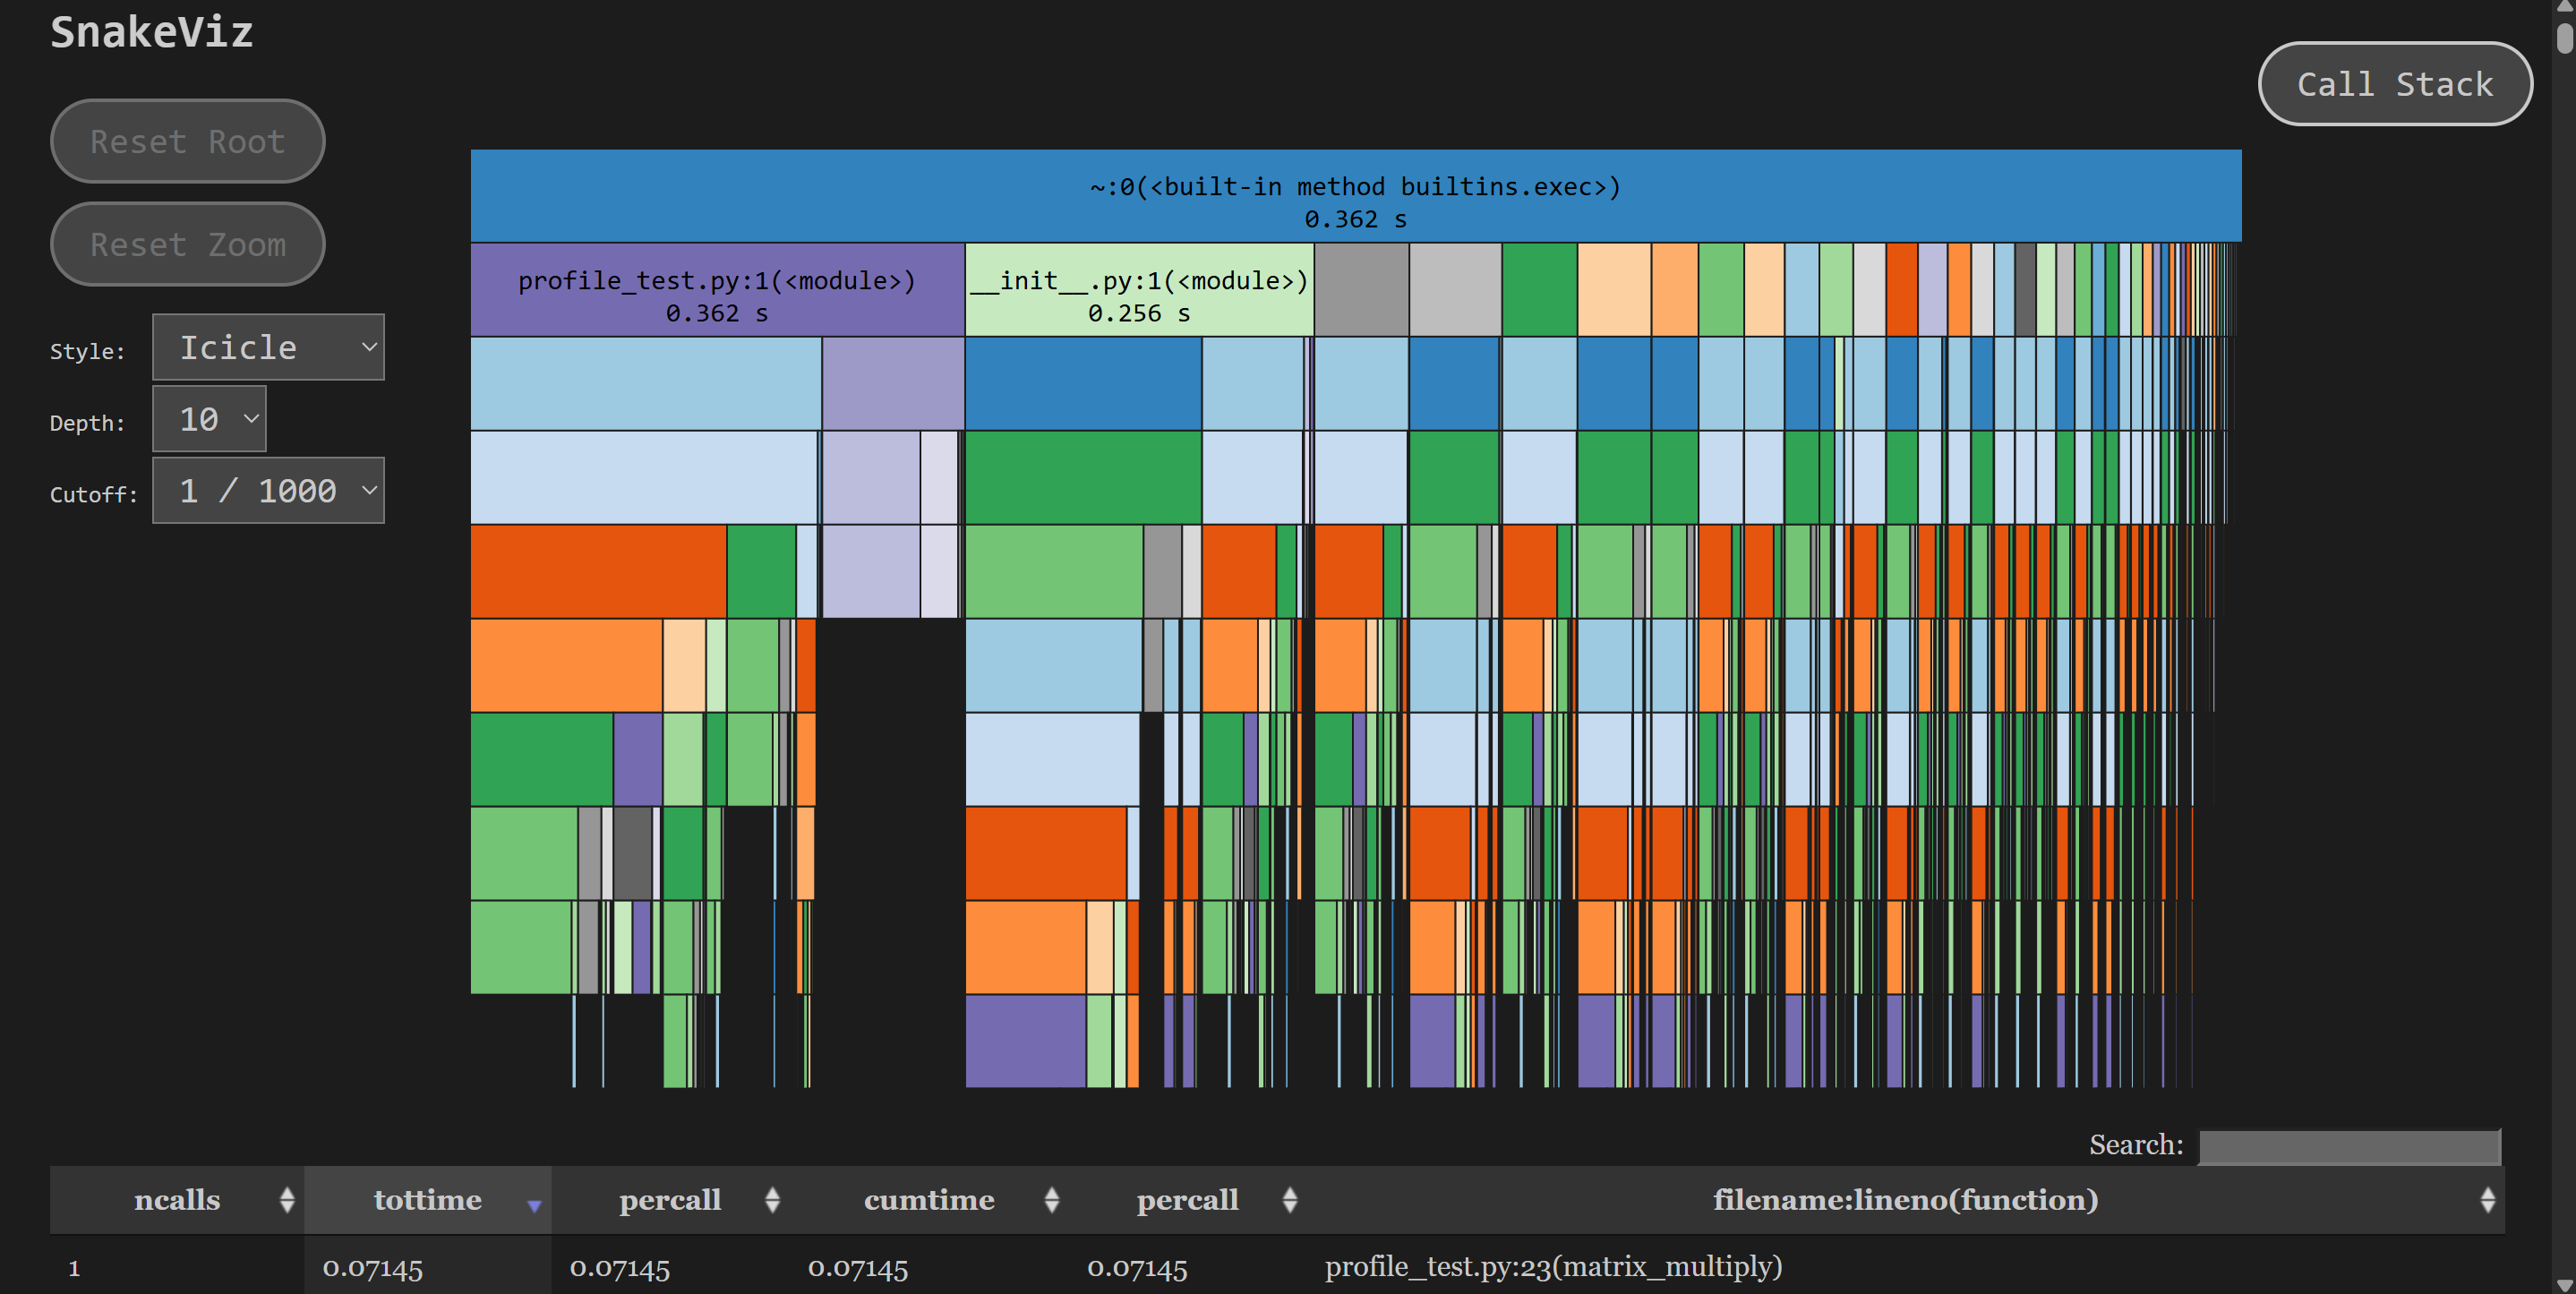
""" Author: Xiyuan Yang xiyuan_yang@outlook.com Date: 2025-04-26 13:10:02 LastEditors: Xiyuan Yang xiyuan_yang@outlook.com LastEditTime: 2025-04-26 21:50:32 FilePath: /Lec6_Debugging/profile_test.py Description: Do you code and make progress today? Copyright (c) 2025 by Xiyuan Yang, All Rights Reserved. """
import numpy as np import random # from memory_profiler import profile from line_profiler import profile
defgenerate_matrix(n): """Generate an n x n random matrix with values between 0 and 1.""" return [[random.random() for _ inrange(n)] for _ inrange(n)]
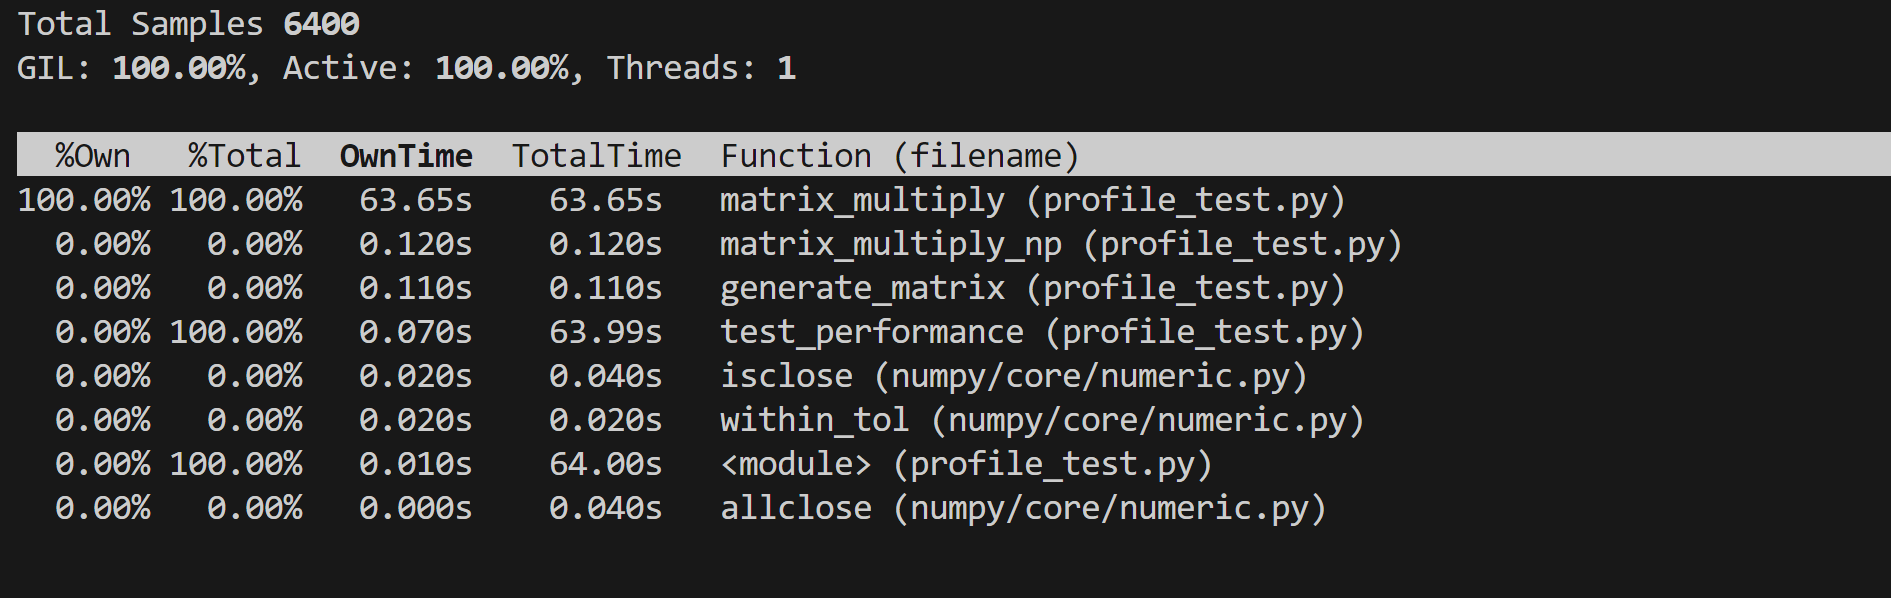
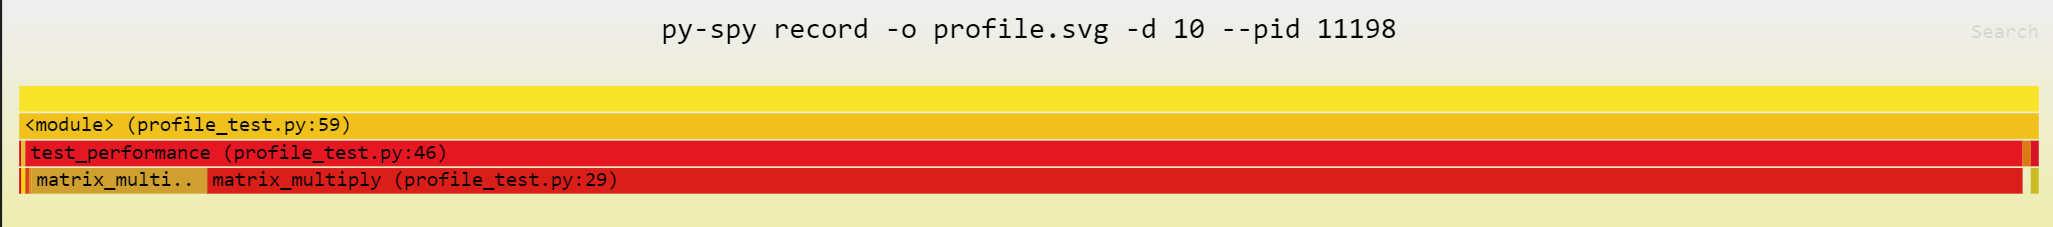
defmatrix_multiply(a, b): """Matrix multiplication (pure Python, intentionally unoptimized).""" n = len(a) result = [[0.0for _ inrange(n)] for _ inrange(n)] for i inrange(n): for j inrange(n): for k inrange(n): result[i][j] += a[i][k] * b[k][j] return result
defmatrix_multiply_np(a, b): """Matrix multiplication (optimized with NumPy).""" return np.dot(a, b)
@profile deftest_performance(n=100): """Test performance of matrix multiplication.""" # Generate two n x n matrices a = generate_matrix(n) b = generate_matrix(n)
# Pure Python implementation print(f"Testing Native Python (n={n})...") result_py = matrix_multiply(a, b)
import numpy as np import random from memory_profiler import profile
defgenerate_matrix(n): """Generate an n x n random matrix with values between 0 and 1.""" return [[random.random() for _ inrange(n)] for _ inrange(n)]
defmatrix_multiply(a, b): """Matrix multiplication (pure Python, intentionally unoptimized).""" n = len(a) result = [[0.0for _ inrange(n)] for _ inrange(n)] for i inrange(n): for j inrange(n): for k inrange(n): result[i][j] += a[i][k] * b[k][j] return result
defmatrix_multiply_np(a, b): """Matrix multiplication (optimized with NumPy).""" return np.dot(a, b)
@profile deftest_performance(n=100): """Test performance of matrix multiplication.""" # Generate two n x n matrices a = generate_matrix(n) b = generate_matrix(n)
# Pure Python implementation print(f"Testing Native Python (n={n})...") result_py = matrix_multiply(a, b)